On December 9, 2025, the Board voted unanimously to place an operational referendum on the April 7, 2026 ballot. Explore the sections below to understand how school funding and property taxes impact our community. This website is designed to help Waupaca residents prepare and make an educated decision on the April 7, 2026 referendum. The referendum question will ask voters to approve $2.75 million per year for two years to support maintaining current district operations, programs, and services.
The official ballot language is:
BE IT RESOLVED by School Board of the School District of Waupaca, Waupaca, Portage and Waushara Counties, Wisconsin that the revenues included in the School District budget be authorized to exceed the revenue limit specified in Section 121.91, Wisconsin Statutes, by $2,750,000 per year for two years, beginning with the 2026-2027 school year and ending with the 2027-2028 school year, for non-recurring purposes consisting of operational and maintenance expenses.
|
How does the 1993 funding model impact Wisconsin schools today, and why did it favor high-spending districts? (Click to expand)
In 1993, state law (often referred to QEO - Qualified Economic Offer) shifted the authority to increase school funding away from the school boards and returned this decision-making power to the entire school community*. This change also limited total teacher increases (salary and benefits) to 3.8%. During the same time, the state limited the annual increase school districts receive from the state to inflation (1993-2010) or less. As part of the QEO, the state also agreed to pay for ⅔ the cost of education funding. This ⅔ funding lasted until 2003. With the QEO comes state control of school district budgets!
*School districts could receive more funding from their local communities through referendums.
Who determines how much a school district can spend? (Click to expand)
It is important to note here that the state controls school district budgets through a complex series of calculations mainly based on
- enrollment
- district property valuation
- previous year spending
*with property valuation and previous year spending used in a district to district comparison manner.
How does our district's history of low spending impact our state funding? (Click to expand)
As previously noted, in addition to student enrollment and property value, the state also takes into consideration how much a district spends during the previous year. As a district that has prided itself on using community resources wisely and only taxing what’s needed, our district spends less per student than 91% of all districts in Wisconsin! As noted in the chart below, which contains the most updated state data, our district spent $15,591.00 per student in 2023-2024, which was $2,719.00 less per student than the state average and $2,259.86 less per student than our neighboring school districts!

When digging a little deeper into our cost per student and our 2023-2024 overall district report cards, you will notice that our “cost per report card point per student” is the lowest compared to our neighboring districts at $233.05, which is $22.62 less per student than the next closest spending district (Iola-Scandinavia).
Why are my property taxes higher if the school didn't increase its budget? (Click to expand)
It comes down to where the money comes from. Think of the budget as a pie with three slices: federal, state, and local taxes. If the state decides to shrink their "slice," the local tax "slice" must grow to keep the pie the same size. A higher tax bill often means the source of the funding shifted, not that the total spending increased. In October, the state reduced our aid by 7%. This wasn't unique to us—over 280 districts in Wisconsin saw similar cuts. Because the state provided less support, the district had to shift $1 million of the existing budget onto local taxpayers to maintain the same level of service for our students. 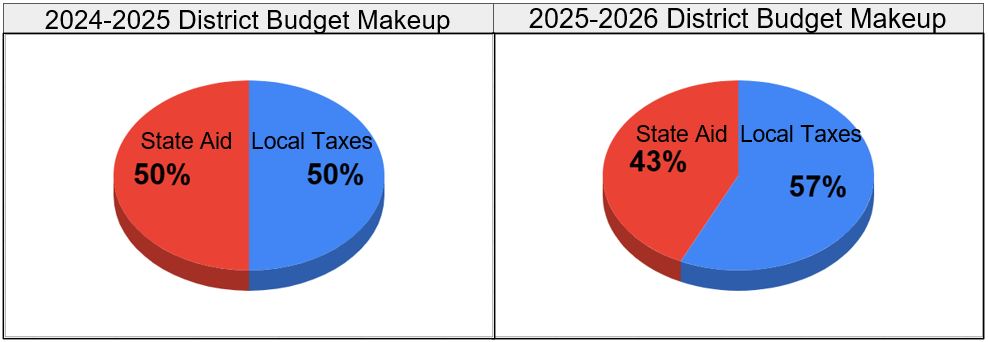
How do referendums in other districts impact our local taxes? (Click to expand)
Taking this notion to a more granular level - let’s say there are two districts with similar enrollments, property values, and previous year budgets. If one of the school districts passes a referendum, they will increase their spending the following year. A referendum will also increase their property taxes. However, as long as the state continues to keep their school district funding formula the same, the school district that passed the referendum will also receive more state aid, while the school district that did not pass a referendum will receive less state aid. To make up for the loss of state aid, the district without a referendum will need to increase their local taxes, not as much as the other district, but their taxes will go up!
So while our school district has been a good steward of tax payer funds, because we will not have any debt from referendums as of May 1, 2026, and other districts passed referendums last year, we will continue to lose state aid.
Please understand that school finance is multifaceted and complex, like a fine analog watch with its interconnected web of gears. Therefore the scenario played out on this page is not as simple as written. However, the principles of the story still hold true - the finances of the 421 districts in Wisconsin are connected!
Is our district’s tax rate higher or lower than the state average? (Click to expand)
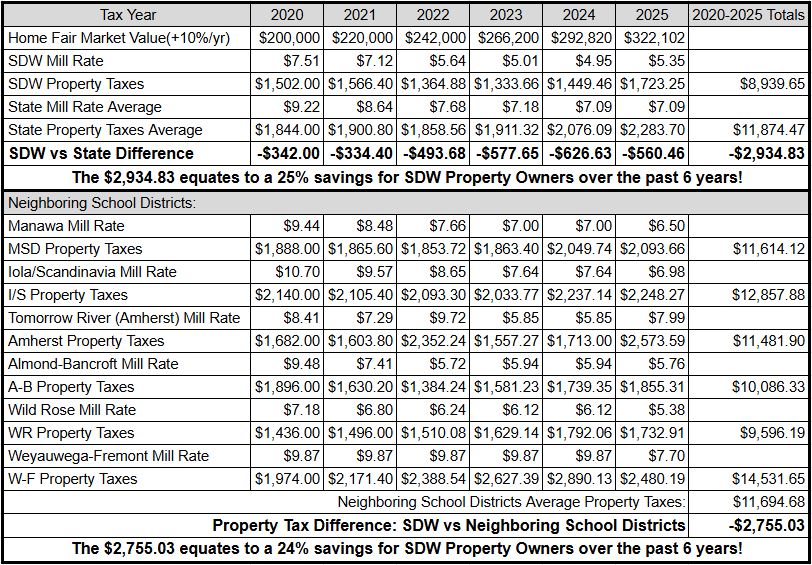
While the results of our district commitment to being fiscally responsible and providing our community with a fantastic return on property tax investments was noted in the previous chart, another example of our fiscal stewardship can be seen in our district property mill rate, or the amount per $1,000 of property value that is taxed by our district. While we understand that no one likes to pay property taxes, it is equally important to know that our district does not want to collect more in property taxes than needed. This belief and actionable way of leading our district is seen in the following chart which shows that our district’s mill rate has been less than the state average for the past 7 years and is anticipated to stay that way for at least the next couple of years!

Another, more concrete way of viewing this data - when looking at mill rates since 2021, the School District of Waupaca has saved their residents 25% in property taxes compared to the state average mill rate or 24% when compared to surrounding districts. The following chart compares school district mill rates and subsequent property taxes for the School District of Waupaca, the state, and surrounding school districts. All property tax rates were based on a hypothetical home valued at $200,000.00 in 2020, increasing in value by 10% per year. While a hypothetical home scenario was used in this example, the outcomes provided by the chart below show how the School District of Waupaca has been and continues to be a great school community that values low school property taxes.
Does the School District of Waupaca prepare students for life after high school? (Click to expand)
- ★ The state report card has our district “Meets Expectations”
- ★ WLC Exceeds Expectations
- ★ CEC Significantly Exceeds Expectations
- ★ We’ve had a student earn a perfect ACT score (36) in each of the last two school years!
- ★ 40% of our HS students participate in athletics
- ★ 25% of our HS students participate in clubs or activities
- ★ We offer 30 different AP, CAPP, and Dual Credit Course Options
- ★ In 2025, 142 WHS students took 207 AP exams
- ★ Over 250 students with dual enrollment (taking post-secondary classes)
- ★ Over 200 students taking multiple career pathway courses
- ★ 17 students doing Youth Apprenticeships
- ★ 69 students participate in Work-Based learning opportunities
- ★ Nearly 50 students are working on industry recognized certifications (e.g., CNA, Welding, Child Care Assistant)
Is the School District of Waupaca foundational to a thriving community? (Click to expand)
- ★ Good schools help attract companies by providing a pool of skilled workers and a location with a high quality of life.
- ★ Educated graduates are better equipped to become future leaders in the community and contribute to its overall well-being.
- ★ The presence of strong schools is a major factor in driving up home values and can lead to overall economic stability.
- ★ Schools provide a central gathering place for families, fostering relationships and trust among neighbors and leading to a more cohesive community. (The Chicago Community Trust, ADHI)
We take great pride in educating our community’s children and will continue to do so while also working to maintain our mission: “Develop our students' capabilities and confidence to achieve their dreams and make the world a better place. The District will provide a safe, compassionate environment while using community resources wisely.”
Who determines how much a school district can spend? (Click to expand)
It is important to note here that the state controls school district budgets through a complex series of calculations mainly based on
- enrollment
- district property valuation
- previous year spending
*with property valuation and previous year spending used in a district to district comparison manner.
How does the budget creation timeline affect the district? (Click to expand)
When it comes to creating a budget, each of the 421 school districts in Wisconsin face the same dilemmas:
- Districts are required by state law to have budgets that run from July 1 to June 30.
- Districts receive final, critical funding information from the state on October 15 (remember district budgets are controlled by the state).
- Districts must approve a budget, and submit it to the state, by October 31.
In reviewing this timeline, note that by the time a district receives its final funding information from the state, the school year is nearly 25% over! While this misalignment of budgetary timing creates some challenges in creating a budget, most districts use a variety of tools and resources to help them predict their final budgetary numbers from the state. However, even the best tools and resources can’t always predict the way a group of elected officials will vote, which is what happened during the last state budget cycle when the WI legislation declined to increase general state aid for districts but instead allowed them to tax locally more.
Who controls the school district budget? (Click to expand)
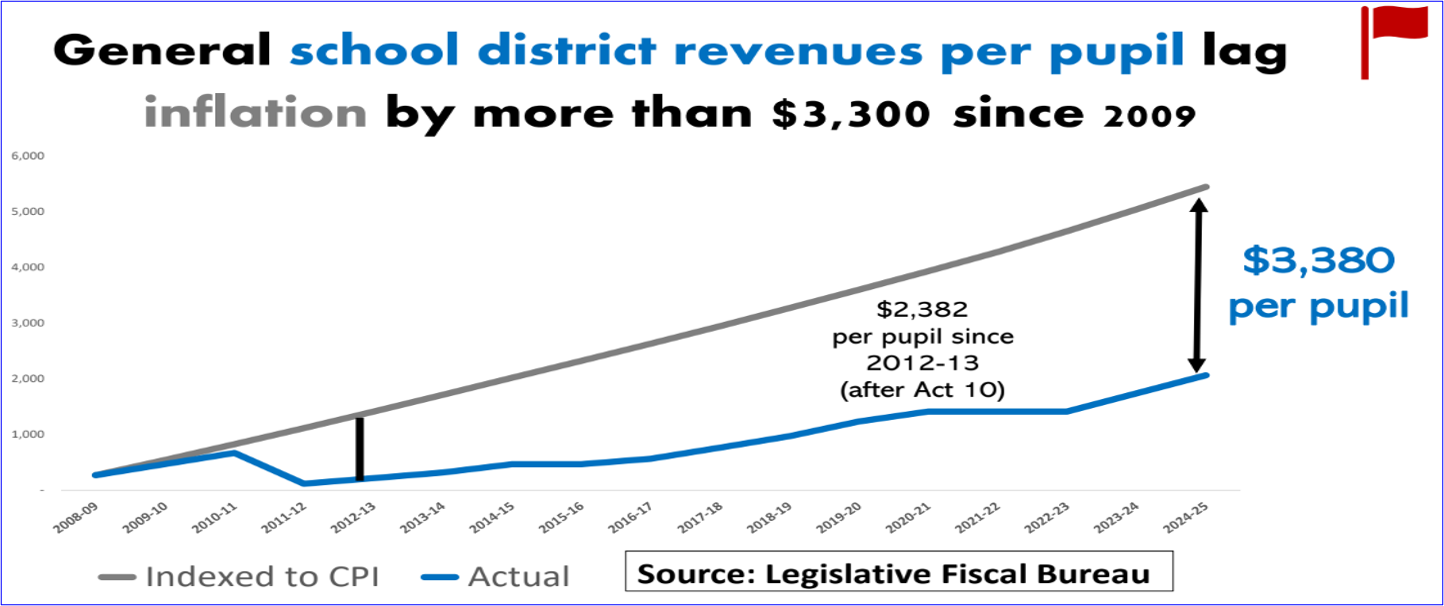
Yes, the state controls local school district budgets. This control really began back in 1993 when the state passed legislation to “control” local spending while also intending to provide equitable education in Wisconsin. In a nutshell, the state distributes money to local districts (based on the state’s budget) and informs them how much local property taxes each district can collect (local tax levy). Each of these dollar amounts are based on a variety of factors, with the most emphasis on student enrollment, property values within the school district, and previous year spending. According to a July 2025 WI Policy Forum article, “ Wisconsin Education Spending Falls Further Behind National Average,” when adjusting for inflation, Wisconsin preK-12 education spending per pupil has increased slightly (2.4%) since 2002. This fact, along with the information noted in Figures 1 and 2 below; Figure 1 shows how education spending per student has dropped below the national average, while Figure 2 shows how Wisconsin now spends a smaller share of personal income on education than the national average, are two solid indicators of just how much control has been placed on school finances over the past 23 years. 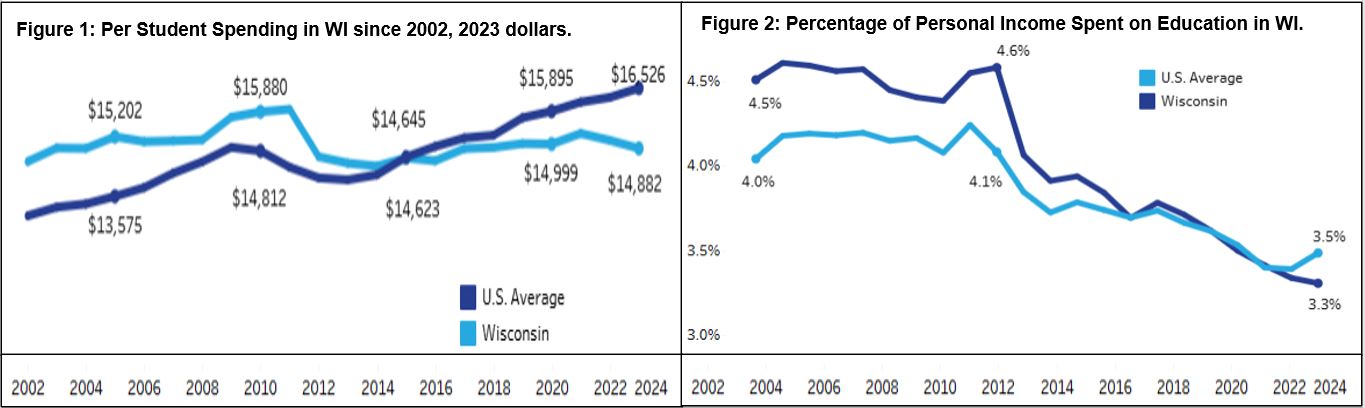
How did the 2025-2027 State Budget impact school districts? (Click to expand)
While the state did not give school districts more general state aid this year (or next year in their 2 year budget), they did give school districts the authority to increase local property taxes by $325/student. This increase impacted our local taxing authority by around $660,000.00, which added about 2% to our budget, while inflation continues to hover around 3%. In addition to the state granting school districts the authority to increase local taxes by $325/student, the state also approved an increase in special education reimbursement. However, this increase was initially touted as reimbursing school districts for 42% and then 45% (2026 and 2027) for costs associated with providing services to students with a disability. While these reimbursement rates are up from last year’s rate of about 30%, the first reimbursement payment to school districts this year was only 35%, not the approved 42%. This resulted in about $175,000.00 less in reimbursement payment than expected. Although the state did provide school districts with additional reimbursements for special education funding, and they did provide districts the authority to increase local tax rates, these additions are not in alignment with inflation, which has been the case since 2009 (as noted previously). While not receiving inflationary increases may be acceptable for a short period of time, not receiving inflationary increases for 15 years is not, especially as with the increasing demands of education! As a result of this funding shortfall, many districts turn to local taxpayers through referendums, which allow school districts to collect more local tax dollars than given by state authority. As noted in the figure below, in 2024, 169 school referendums passed (241 questions were asked)! Keep in mind that there are only 421 school districts in Wisconsin. 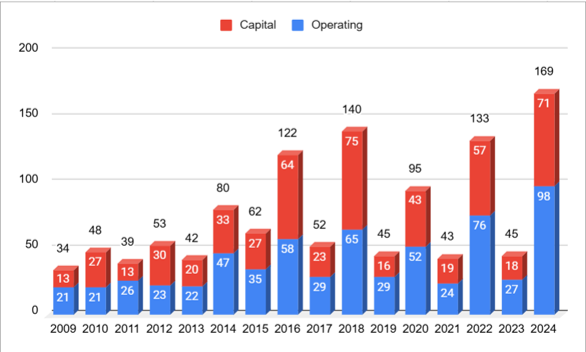
How are school district budgets controlled by other districts? (Click to expand)
Another unique fact about school funding is that local property values and previous year spending are used in comparison to the other 420 school districts in WI. This means that a school district’s state funding dollars are impacted by the other 420 school districts' enrollment, property values, and previous year spending. Think of the state education budget as a pie divided into 421 slices. If one slice grows, the other slices must shrink unless the state increases the total pie—which did not happen for general education funding in the current 2025-2027 budget.
The result of this shared taxation legislation is that some districts receive more state funding per student than others, varying year to year based on property value and district spending. For example, a recent Cap Times article noted that Madison School District referendums totaling $607 million accounted for 17% of the rise in statewide K-12 tax levy increases. Over time, these gaps widen, creating "high spending" and "low spending" districts.
How do rising property values impact our district’s state aid? (Click to expand)
As any homeowner or home seeker knows, property values in Wisconsin, and in many other parts of the US, have grown dramatically over the past few years. According to the Wisconsin Realtors Association, property values in Waupaca County have increased by over 55% since 2021! While an increase in property value is good for homeowners when considering home equity, increased home values often result in homeowners having higher property taxes, even though the percentages charged by each taxing entity may not have changed. Another important fact to keep in mind about property taxes is that school districts do not set home values; property values are set through a dual system consisting of local assessors and the Wisconsin Department of Revenue. Through this dual system, the State of Wisconsin determines which school districts are “property rich” and which ones are “property poor.” This information is then used in an effort to provide an equal educational opportunity for all students in Wisconsin by providing the property poor districts with more state collected tax dollars and the property rich school districts with less. As home values in our district continue to rise, the state sees us as more of a “property rich” district and thus provides us with less state aid.
Is our district’s enrollment declining, and how does that affect our funding? (Click to expand)
While our student enrollment has been trending up over the past couple of years, this year’s first state required count, the Third Friday Count in September, showed a slight decline in our enrollment. Although this is not a good indicator, there are two important facts related to this indicator. First, according to an October 2025 Milwaukee Journal Sentinel article, over three-quarters of the state’s 421 districts lost students this year, a trend that has been continuing for years (Huynh, Kayla. "Wisconsin Public School Enrollment Declines Continue as Vouchers Grow, New Data Show." Milwaukee Journal Sentinel, 21 Oct. 2025. Another unique factor related to school budgeting is that enrollment numbers used in district financial calculations are based on a three year average. Using a three year average helps smooth out financial implications due to shifting enrollment. For our district, although our September 2025 enrollment was down from our January 2025 enrollment, our three year enrollment trend was still positive.
What impact do school vouchers have on School District of Waupaca? (Click to expand)
A factor often misunderstood that impacts public school enrollment and thus public school finances are vouchers, or private school payments. When parental choice programs first came to Wisconsin in 1990, these first voucher schools were limited to the city of Milwaukee. However, since 1990, the parental choice programming and funding has expanded to cover all of Wisconsin.
In terms of funding for parent choice programs or voucher schools, our state legislation continually works to provide private schools with more funding than public schools. For example, if a public school student open enrolls into another public school, the receiving school receives $10,102.00 of state funding, while the district the student is leaving loses $10,102.00 of state funding. However, if the same student open enrolls into a voucher school, if the student is in grades K-8 the amount of funds transferred increases to $10,877.00 or $13,371 if the student is in grades 9-12.
Since 2019, School District of Waupaca residents have been required by law to give over $5 million to the Wisconsin Voucher system. In our current budget, this amount increased by nearly 20% from last year to $1.55 million. This year’s voucher payment of $1.55 million represents nearly 10% of all of the local property taxes collected by our school district. Another way to think about this is to realize that for every $1.00 you pay in local property taxes, $0.10 goes towards providing a student/family who qualifies with funds to attend a private school.
Understanding Referendums
What are the different types of school referendums? (Click to expand)
There are three types of referendum, two of which are used to support the district in maintaining their current operations or in paying their bills. These types of referendums are called operational referendums. There are two types of operational referendums, the first is simply called an operational referendum - it asks for a specific amount of money for a specific amount of time. For example, the SDW will be asking tax payers on April 7, 2026, for a $2.75 million operational referendum for each of the 2026-2027 and 2027-2028 school years. The other type of operational referendum is a recurring operational referendum. This allows the school district to increase its local tax rate by the approved dollar amount forever.
The third type of referendum is called a capital referendum. This type of referendum is typically used for large maintenance or building projects. A key difference between an operational and capital referendum is that a capital referendum means that the school district is borrowing money, meaning that they are scheduled to repay a loan that involves spending local tax dollars on interest payments.
How do referendums in other districts impact our local taxes? (Click to expand)
Taking this notion to a more granular level - let’s say there are two districts with similar enrollments, property values, and previous year budgets. If one of the school districts passes a referendum, they will increase their spending the following year. A referendum will also increase their property taxes. However, as long as the state continues to keep their school district funding formula the same, the school district that passed the referendum will also receive more state aid, while the school district that did not pass a referendum will receive less state aid. To make up for the loss of state aid, the district without a referendum will need to increase their local taxes, not as much as the other district, but their taxes will go up!
So while our school district has been a good steward of tax payer funds, because we will not have any debt from referendums as of May 1, 2026, and other districts passed referendums last year, we will continue to lose state aid.
Please understand that school finance is multifaceted and complex, like a fine analog watch with its interconnected web of gears. Therefore the scenario played out on this page is not as simple as written. However, the principles of the story still hold true - the finances of the 421 districts in Wisconsin are connected!
Does the recently passed Madison School District $607 million referendums negatively affect the School District of Waupaca’s budget and our local taxpayers? (Click to expand)
According to the Wisconsin Policy Forum, a nonpartisan research group, the amount of state aid a school district receives is partially based on how much they spent the previous school year, and because the Madison School District passed two huge referendums, their amount of the state tax dollars allocated to schools will increase, which reduces the amount of money for the other 420 school districts in WI, like Waupaca. To make up for the loss, we needed to increase our local tax rate. The financial connectedness of school districts is due to state control of school district budgets.
|
*This page is a living document and is subject to regular updates.
|
|